Recovery Readiness
Calculator
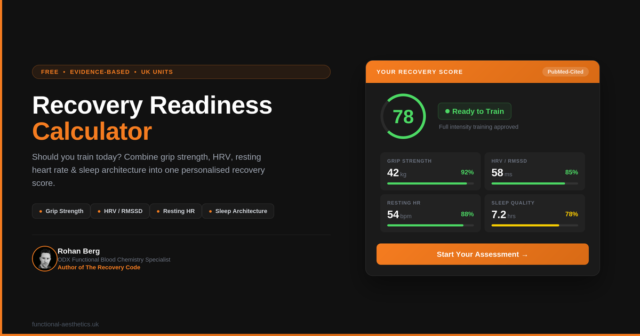
Should you train today? Combine grip strength, HRV, resting heart rate, and sleep architecture to find out — backed by published research, personalised to your age, sex, and training level.
Grip Strength — optional
Heart Rate Variability
Resting Heart Rate
Sleep Architecture
Your Results Are Ready
Enter your email to unlock your personalised recovery score, training signal, and evidence-based recommendations.
Today's Training Signal
Want the Full Picture?
This calculator uses surface-level recovery markers. A functional blood chemistry analysis examines 50+ biomarkers — including cortisol, testosterone, iron, thyroid, and inflammation markers — to uncover hidden patterns that standard NHS tests miss.
How the Recovery Readiness Calculator Works
This calculator combines four evidence-based recovery markers into a single composite score, personalised by your age, sex, and training level. Rather than relying on any single metric, the multi-marker approach reflects what current sports science supports: that recovery is a multisystemic process involving the autonomic nervous system, neuromuscular function, cardiovascular status, and sleep quality.
Why Multiple Markers Matter
A scoping review published in Sports Health examined biomarkers and tools for diagnosing overtraining syndrome and found that no single test is definitive. The researchers concluded that combinations of hormonal, psychological, autonomic, and performance variables are needed to assess recovery status accurately. This calculator operationalises that principle for daily use.
Grip Strength as a Recovery Marker
Grip strength serves as a proxy for central nervous system readiness. The normative reference values used in this calculator are derived from the US NIH Toolbox study of 1,232 participants aged 18 to 85, which provides age and sex-specific reference data. When you enter a personal baseline, the calculator shifts to percentage-of-baseline scoring, which is more sensitive to acute fatigue than population norms.
HRV and Autonomic Recovery
Heart rate variability — specifically the RMSSD metric — reflects cardiac vagal regulation and parasympathetic recovery status. Research on elite swimmers preparing for Olympic trials demonstrated that HRV-based readiness metrics can detect changes in physiological status between overload, recovery, and taper phases. A study on autoregulated training in speed skaters found that athletes using HRV-based readiness thresholds achieved significantly larger gains in VO2max, peak power, and autonomic balance compared to conventional programming.
Resting Heart Rate
Research on elite rugby union players found that autonomic nervous system indices including RMSSD were significantly dysregulated the day after matches, with meaningful recovery occurring by match-day plus three. An elevated resting heart rate above individual baseline is one of the most accessible daily recovery signals available.
Sleep Architecture: Deep Sleep and REM
A narrative review in Sleep and Breathing examined the physiological mechanisms linking sleep to athletic recovery and found that slow-wave sleep plays an important role in physical recovery, with its increase being linked to growth hormone production. The review noted that when training volume increases, a corresponding increase in SWS is usually observed — but overtraining may disrupt this adaptive response.
A systematic review and meta-analysis in Sleep Medicine Reviews found that even low doses of alcohol reduce REM sleep duration, with disruptions worsening progressively with higher intake. REM sleep is particularly important for motor skill consolidation and cognitive recovery. The systematic review in Sports Medicine Open found that increasing sleep duration was the most effective intervention for improving both physical and cognitive performance.
Who Should Use This Calculator?
Overtrained Athletes
If your HRV has crashed, your performance has tanked, and you cannot recover between sessions, this calculator helps you objectively assess whether you are ready to train or whether your body needs more recovery time. Persistent low scores — especially combined HRV suppression and elevated resting heart rate — may indicate overreaching or overtraining syndrome. Where training must continue, IV drip therapy for athletes can support accelerated recovery by delivering targeted micronutrients directly into the bloodstream.
Burnt-Out Professionals
Exhausted, wired-but-tired, and your blood tests come back “normal”? Standard NHS reference ranges are designed to detect disease, not optimise function. Poor sleep architecture, suppressed HRV, and declining grip strength can all occur within “normal” ranges. This calculator flags those patterns before they become clinical.
Men Experiencing Low Energy
Low energy, low libido, low mood — but no clear answers from standard testing. Recovery readiness scoring can help identify whether your body is in a state of chronic under-recovery. If low testosterone may be a contributing factor, our free testosterone symptom calculator can screen your symptoms in under two minutes. For a deeper investigation, a functional blood chemistry analysis examines 50+ biomarkers using optimal ranges.
Frequently Asked Questions
How do I know if I’m recovered enough to train?
The most reliable approach combines objective metrics with how you actually feel. Check your morning HRV (within 10% of your 7-day average), resting heart rate (not elevated more than 5 bpm above baseline), and sleep quality (7+ hours with adequate deep and REM sleep). But metrics alone aren’t enough — The Recovery Code framework also requires that your subjective energy is 6+/10, your motivation feels intrinsic (not forced), and you’ve fully recovered from your previous session. If all five checkpoints are green, proceed with your planned activity. If any are red — especially if you’re forcing yourself despite the numbers looking acceptable — reduce or skip the session. Your body speaks in whispers before it speaks in screams.
What is a good HRV score for recovery?
There is no universal “good” HRV score — it varies significantly by age, sex, fitness level, and genetics. What matters is your personal baseline and trends over time. An RMSSD reading within or above your 7-day rolling average indicates good parasympathetic recovery. A sustained drop of 15–20% below baseline for two or more consecutive days suggests incomplete recovery.
Crucially, a high HRV reading doesn’t always mean you’re ready to push harder. During overtraining recovery, HRV can temporarily spike above previous baselines — a phenomenon called supercompensation. This isn’t a signal to ramp up aggressively; it’s a sign your stress-response systems are regaining capacity. Use next-day recovery data (HRV trend, sleep quality, and subjective energy) to guide every increase in training load.
Why does grip strength indicate recovery status?
Grip strength reflects central nervous system (CNS) readiness because it requires coordinated neuromuscular activation. Research shows grip strength declines measurably during systemic fatigue, overreaching, and overtraining syndrome. A drop of 5–10% below your personal baseline suggests residual neuromuscular fatigue that may not yet be reflected in your heart rate or HRV data.
The normative reference values used in this calculator come from the NIH Toolbox project, which provides age- and sex-specific benchmarks. A hand dynamometer (available from £15–30) is one of the simplest and most cost-effective tools for tracking recovery objectively.
How long does it take to recover from overtraining syndrome?
Recovery from OTS is measured in months, not weeks. The timeline depends on severity, but most cases follow a four-phase pattern: Acute Recovery (weeks 1–4), Stabilisation (months 1–3), Functional Recovery (months 3–6), and Performance Restoration (months 6–18+). Mild overreaching may resolve in 2–4 weeks with complete rest, but true OTS typically requires 3–12+ months of systematic recovery.
Rushing the timeline is the single most common mistake. Biology doesn’t negotiate — twelve to eighteen months of patient, systematic recovery can lead to supercompensation, where your HRV, training capacity, and performance eventually exceed pre-OTS levels. Targeted cellular support such as NAD+ therapy may assist mitochondrial recovery during the stabilisation phase, though this should always be assessed alongside functional blood markers. Forcing through leads to relapse and a longer total recovery period.
What are the early warning signs of overtraining syndrome?
OTS warning signs span physical, mental, and emotional domains. Physical signs include persistent fatigue that doesn’t improve with rest, elevated resting heart rate (5+ bpm above baseline), decreased HRV, frequent illness, unexplained muscle soreness, sleep disturbances despite exhaustion, and changes in appetite or weight.
Mental and emotional red flags include decreased motivation to train, irritability and mood swings, brain fog and difficulty concentrating, reduced libido, and normal stressors feeling overwhelming. No single symptom confirms OTS — it’s the combination and persistence of multiple signs that matters. If you score below 30% on this calculator for 3+ consecutive days, consider seeking professional assessment including comprehensive blood work to identify hidden drivers such as hormonal imbalances, inflammatory markers, and thyroid dysfunction.
How does deep sleep affect athletic recovery?
Deep sleep (slow-wave sleep) is when your body does its most critical physical repair work. It’s associated with peak growth hormone secretion, tissue repair, and immune system restoration. Research shows that when training volume increases, deep sleep typically increases in response — but overtraining can disrupt this adaptive pattern, creating a vicious cycle of poor recovery.
Adults typically need 1–2 hours of deep sleep per night, roughly 15–25% of total sleep time. Less than 45 minutes may indicate impaired physical recovery capacity. Sleep optimisation is a foundation of OTS recovery — bedroom temperature of 18–20°C, complete darkness, consistent schedule (±30 minutes), morning light exposure within 30 minutes of waking, and a digital sunset 90 minutes before bed are all evidence-based strategies that support deep sleep architecture.
Can I use this calculator without a wearable device?
You need at least 3 of the 4 core metrics (grip strength, HRV, resting heart rate, sleep) for a meaningful score. Resting heart rate can be measured manually each morning before rising. Grip strength requires a hand dynamometer (available from £15–30 online). HRV measurement requires a chest strap app like HRV4Training or a wearable device.
The sleep architecture fields (deep sleep, REM sleep) are optional but significantly improve accuracy. These require a wearable such as WHOOP, Oura Ring, Garmin, or Apple Watch. If you don’t have detailed sleep data, the calculator still provides a useful recovery assessment from the other metrics — but investing in even basic sleep tracking can reveal patterns that subjective assessment alone may miss.
What should I do if my recovery score is consistently below 55%?
A persistent score below 55% — the Red Zone — indicates significant accumulated fatigue and potential overtraining. Your immediate priorities should be: complete training cessation for a minimum of 5–7 days, committing to 9+ hours of sleep opportunity per night, and focusing on nutritional foundations (adequate protein at 1.6–2.2g/kg bodyweight, anti-inflammatory whole foods, and hydration).
If your score remains in the Red Zone for 2+ weeks despite rest, this strongly suggests underlying physiological imbalances that metrics alone won’t reveal. Comprehensive functional blood work — covering testosterone, cortisol, inflammatory markers, thyroid function, and key nutritional markers — can identify the hidden drivers of your fatigue and inform a targeted recovery protocol. A health optimisation consultation delivers a personalised action plan based on your specific blood chemistry patterns. Standard NHS blood panels often miss the subtle patterns that functional blood chemistry analysis can detect.
References
- Carrard J, et al. Diagnosing Overtraining Syndrome: A Scoping Review. Sports Health. 2022;14(5):665-673.
- Wang YC, et al. Hand-Grip Strength: Normative Reference Values for Individuals 18 to 85 Years. J Orthop Sports Phys Ther. 2018;48(9):685-693.
- Bulte KR, et al. Use of Heart-Rate Variability to Examine Readiness to Perform in Swimmers. Int J Sports Physiol Perform. 2025;20(7):918-924.
- Di P, et al. Autoregulated macro-microcycle training enhances physiological reserve in speed skaters. BMC Sports Sci Med Rehabil. 2025;18(1):47.
- Grainger A, et al. Autonomic Nervous System Indices of Player Readiness During Rugby Union Microcycles. J Strength Cond Res. 2022;36(11):3173-3178.
- Bachero-Mena B, et al. Enhanced Strength and Sprint Levels, and Changes in Blood Parameters during a Complete Athletics Season. Front Physiol. 2017;8:637.
- Barreira J, et al. Exploring the physiological mechanisms of sleep’s influence on athletic performance and recovery. Sleep Breath. 2025;29(6):354.
- Gardiner C, et al. The effect of alcohol on subsequent sleep: A systematic review and meta-analysis. Sleep Med Rev. 2024;80:102030.
- Cunha LA, et al. The Impact of Sleep Interventions on Athletic Performance: A Systematic Review. Sports Med Open. 2023;9(1):58.
- Claudino JG, et al. Which parameters to use for sleep quality monitoring in team sport athletes? BMJ Open Sport Exerc Med. 2019;5(1):e000475.
This tool is for educational purposes only and does not constitute medical advice. Results are estimates based on published normative data and should be interpreted alongside professional guidance. Always consult a qualified healthcare professional before making changes to your training or recovery protocols. Built by Rohan Berg, ODX Functional Blood Chemistry Specialist. Last updated: February 2026.


